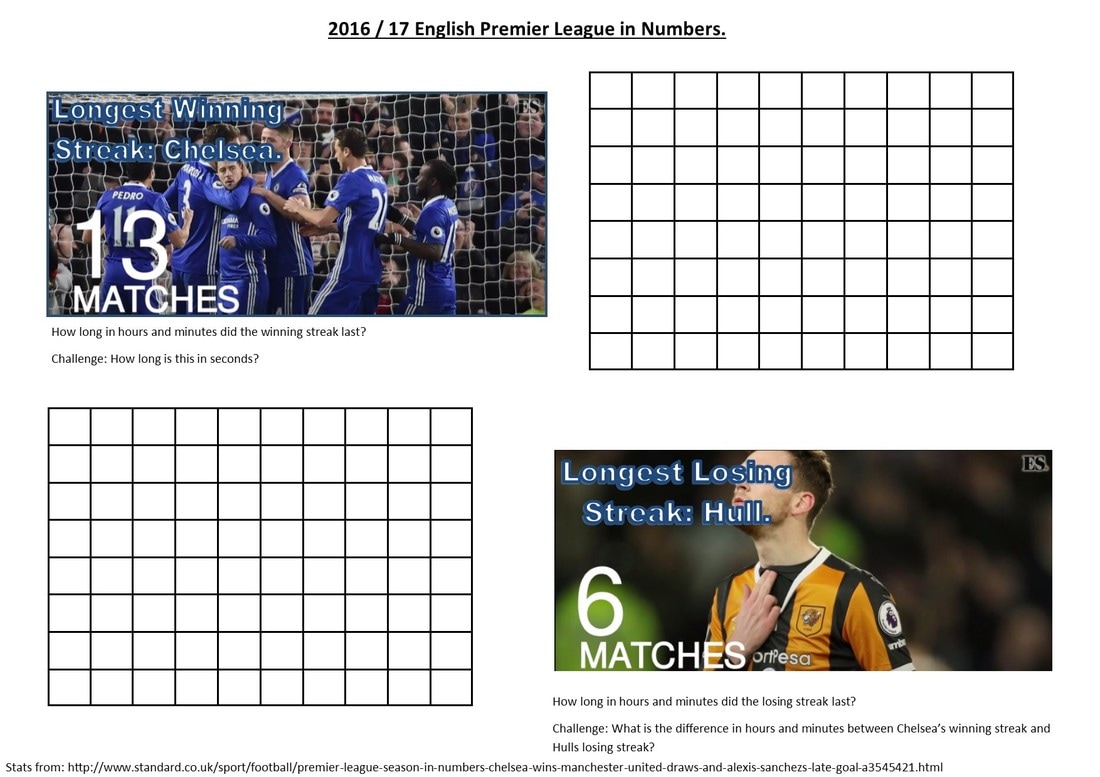
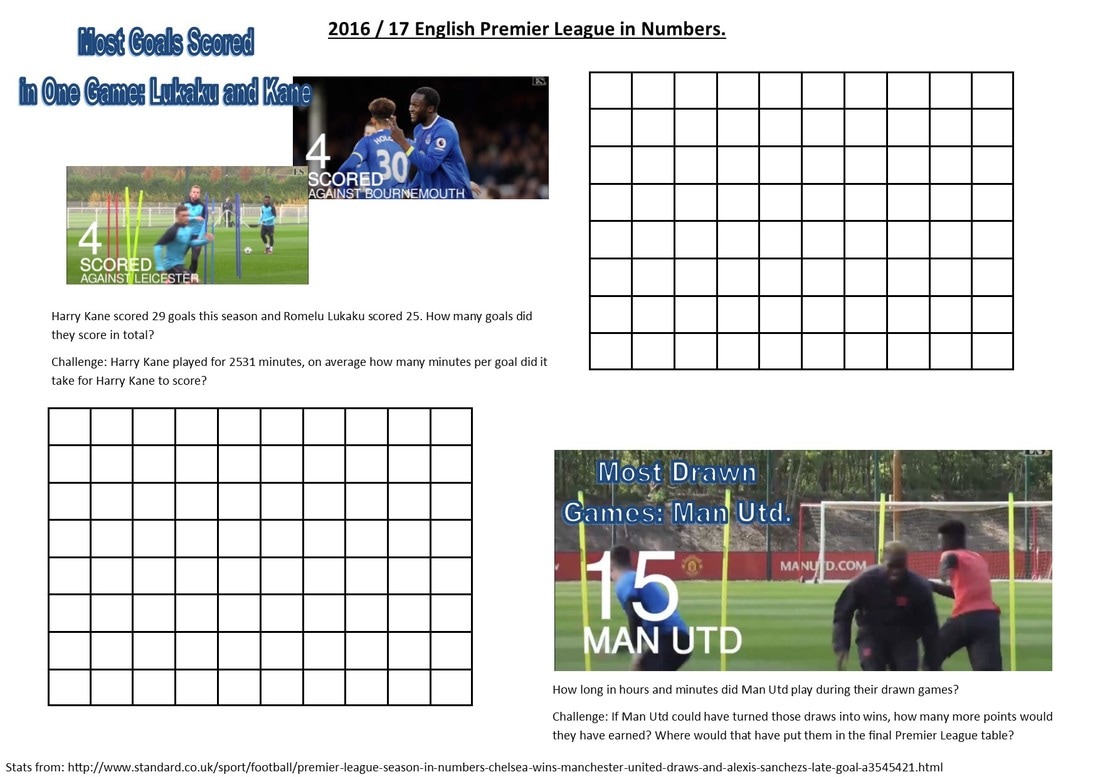
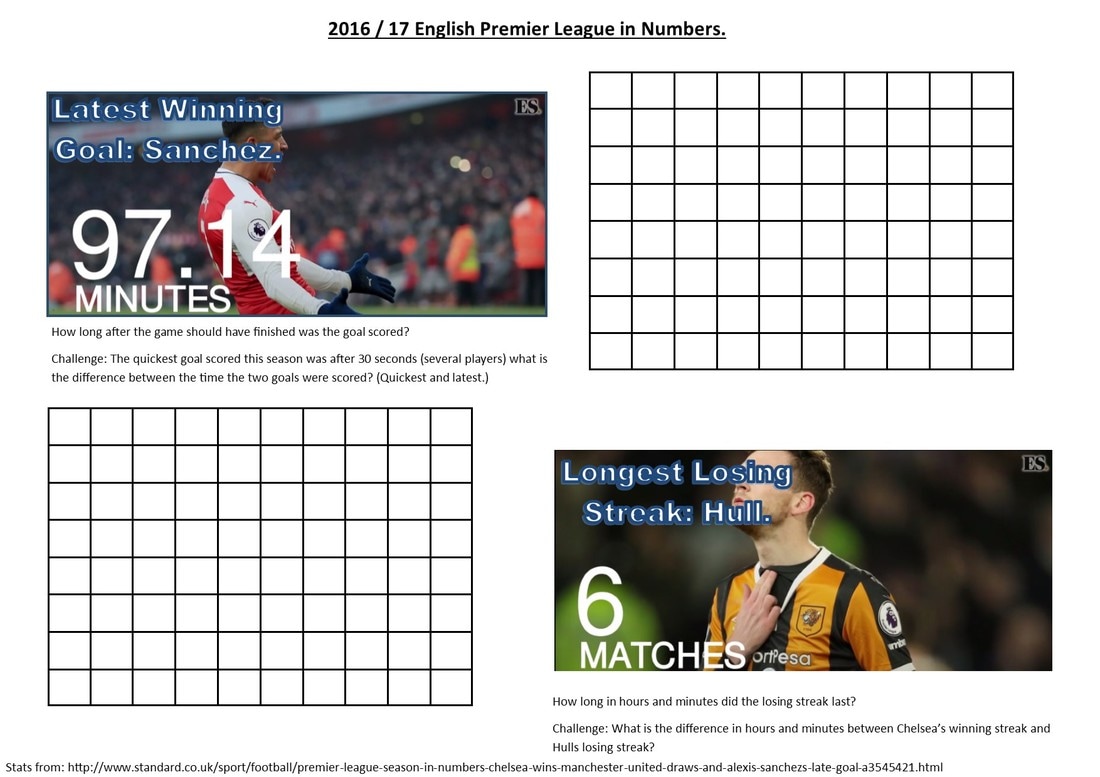
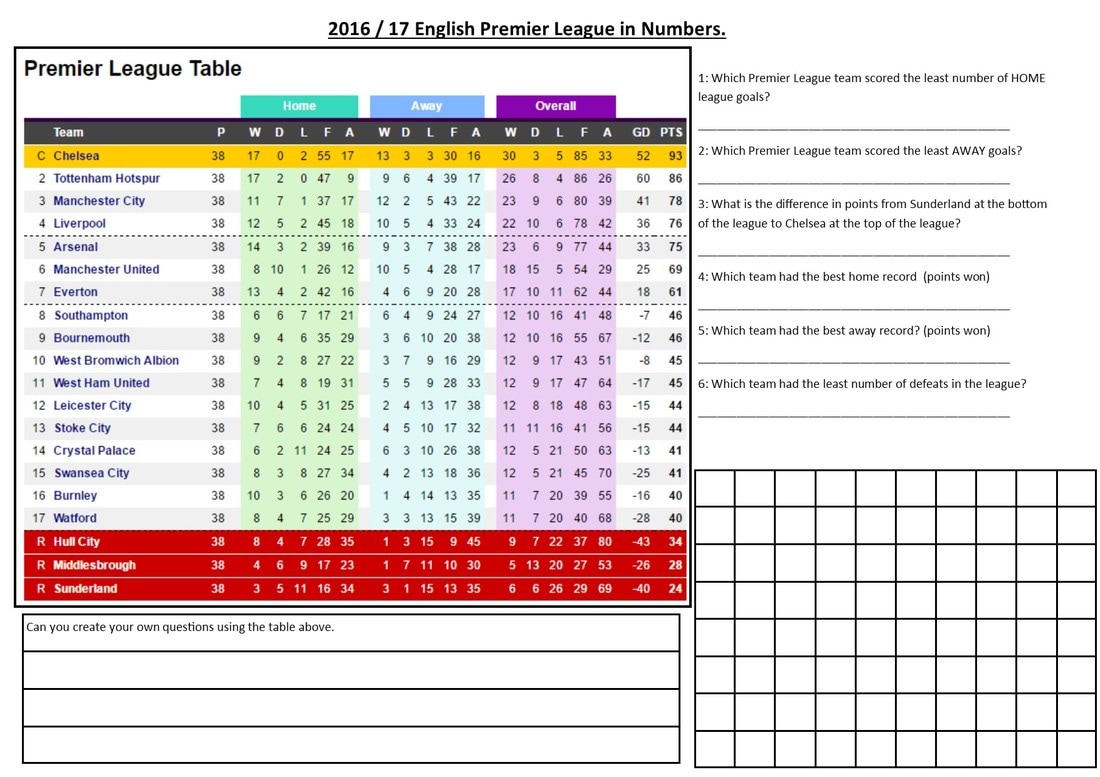
The Premier League 2016/17 in Numbers.
|
| ||||
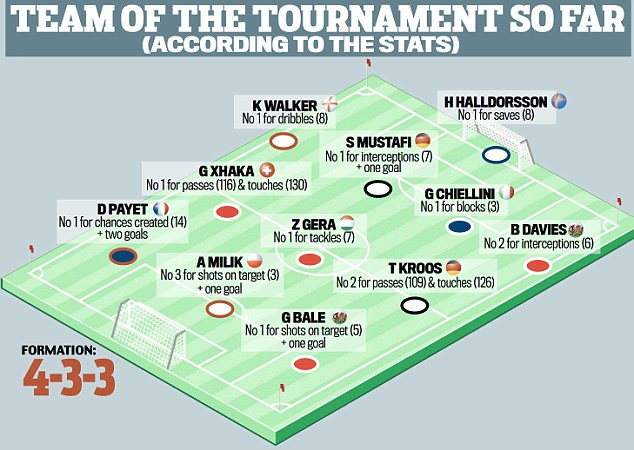
Euro 2016 Team of the Tournament Week 1.
Euro 2016 Stat Predictions.

|
| ||||
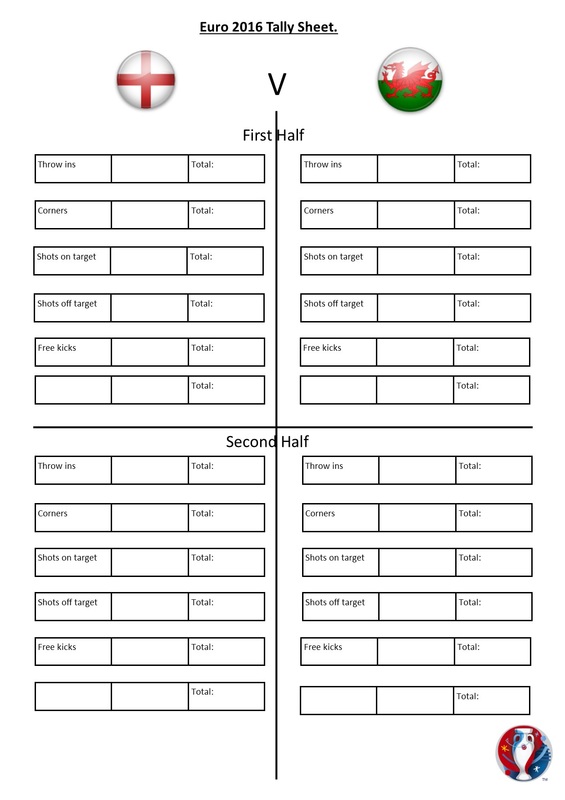
Editable Euro 2016 Tally Sheet.
Tally sheet for children to use while watching a match, can be used in school or at home as homework.
| euro2016tallysheet.pub |
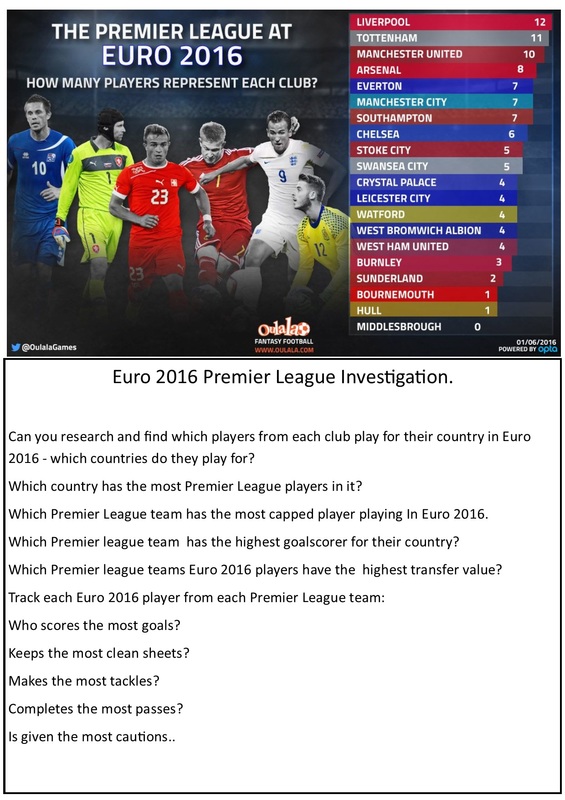
Euro 2016 Premier League Investigation.
|
| ||||
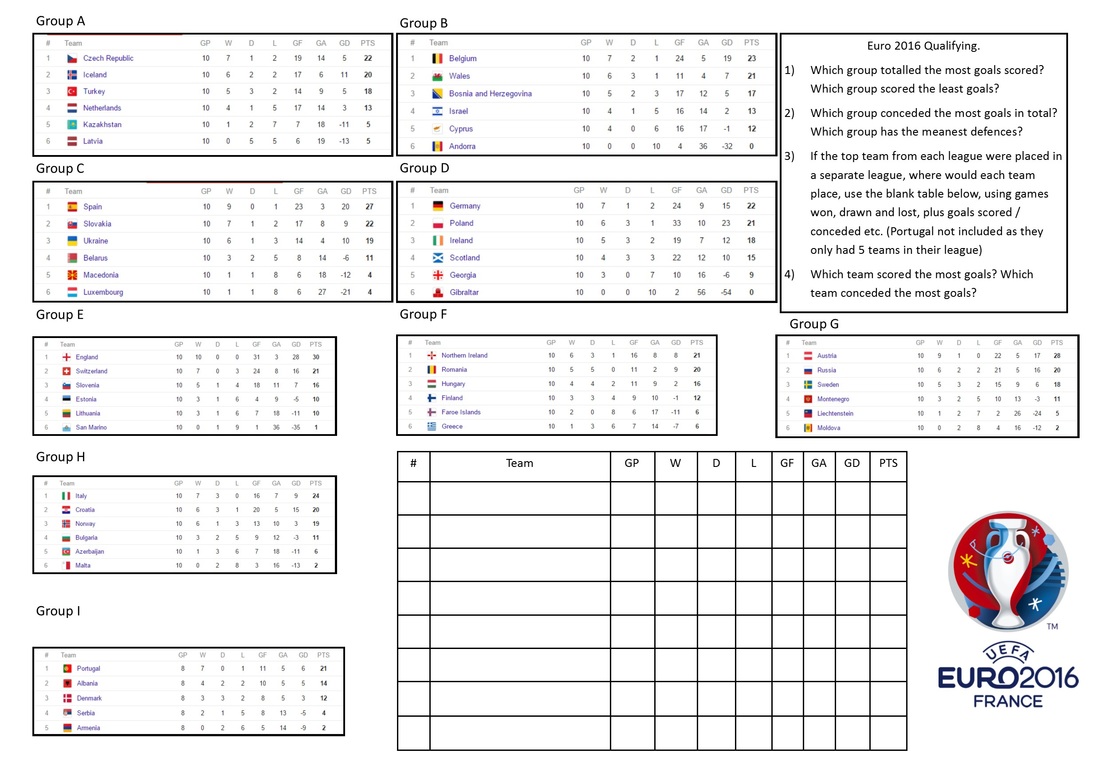
Euro 2016 Championship Qualifying Maths.
| euro2016mathsqual.pdf |
FA Cup Final 2016 Stats.
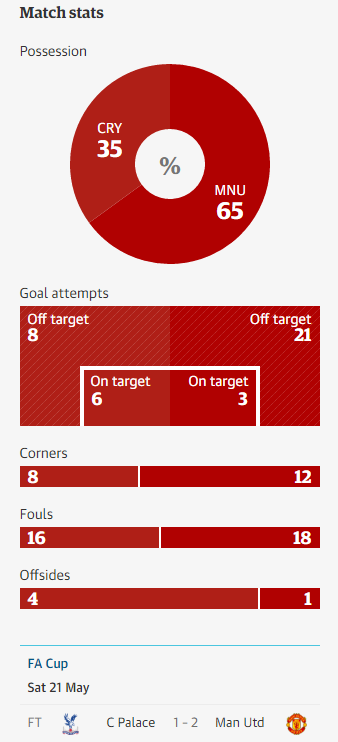
Here are the stats from yesterdays FA Cup Final - did Man Utd deserve to win based on these stats?
Most Successful Clubs.
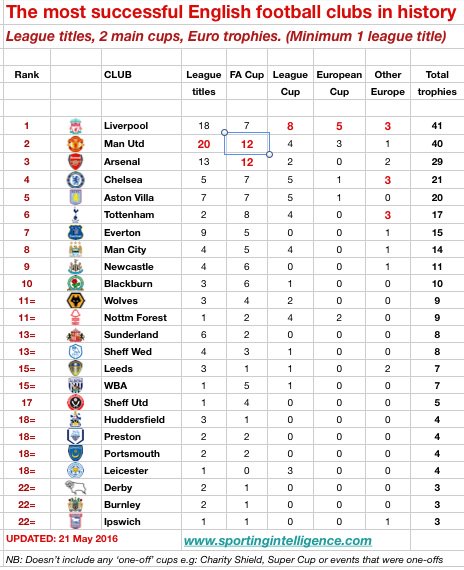
Love this table from @sportingintel
What if you weighted the different trophies with different points:
League Title 10 points. European Cup 9 points. FA Cup 8 points. Other Europe 7 points. League Cup 6 points.
Who would then be the most successful team?
What if you weighted the different trophies with different points:
League Title 10 points. European Cup 9 points. FA Cup 8 points. Other Europe 7 points. League Cup 6 points.
Who would then be the most successful team?
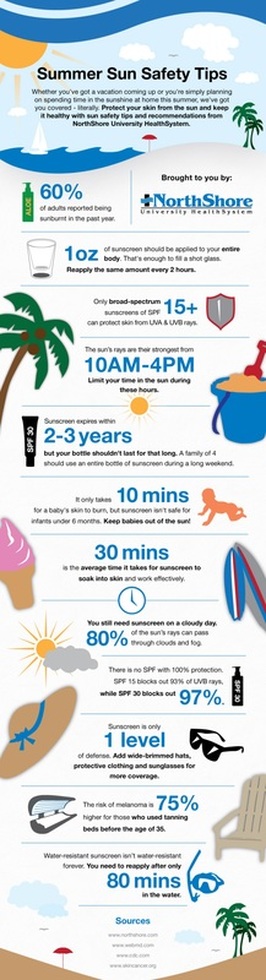
Sun Safety.
| summersafetya3.pdf |
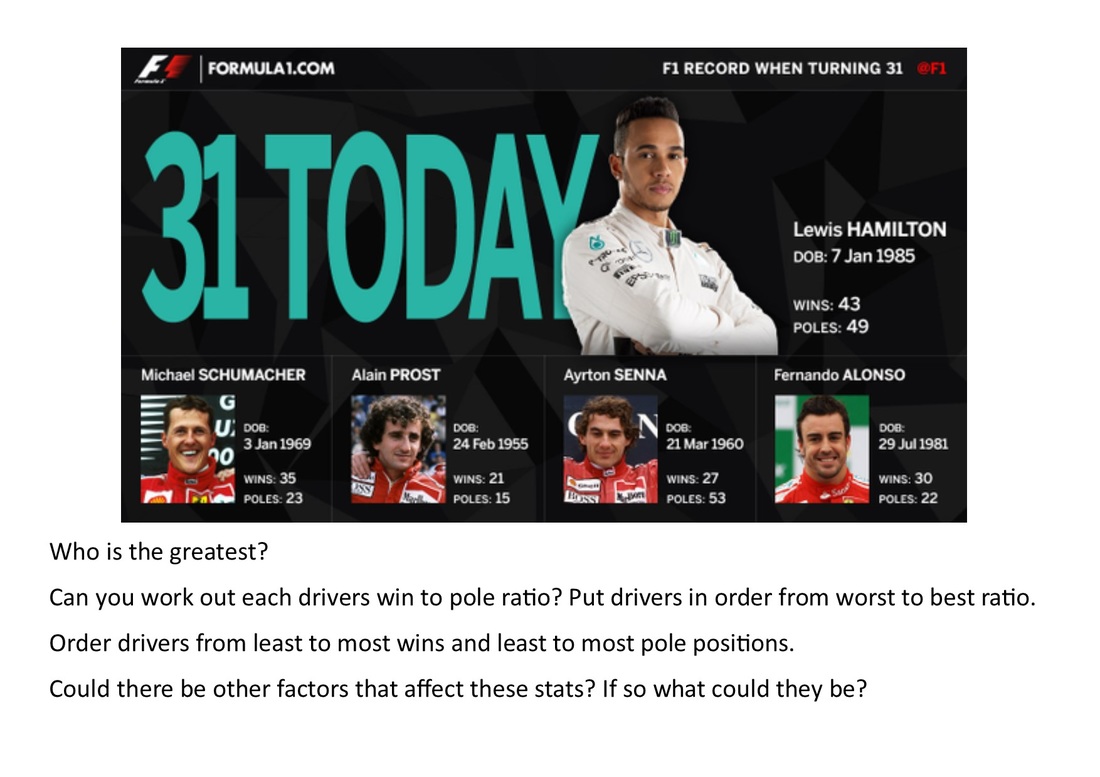
Formula 1: Lewis Hamilton at 31
| lewishamiltonat31.pdf |
Rugby World Cup 2015 Maths Resources.
Rugby World Cup Maths.
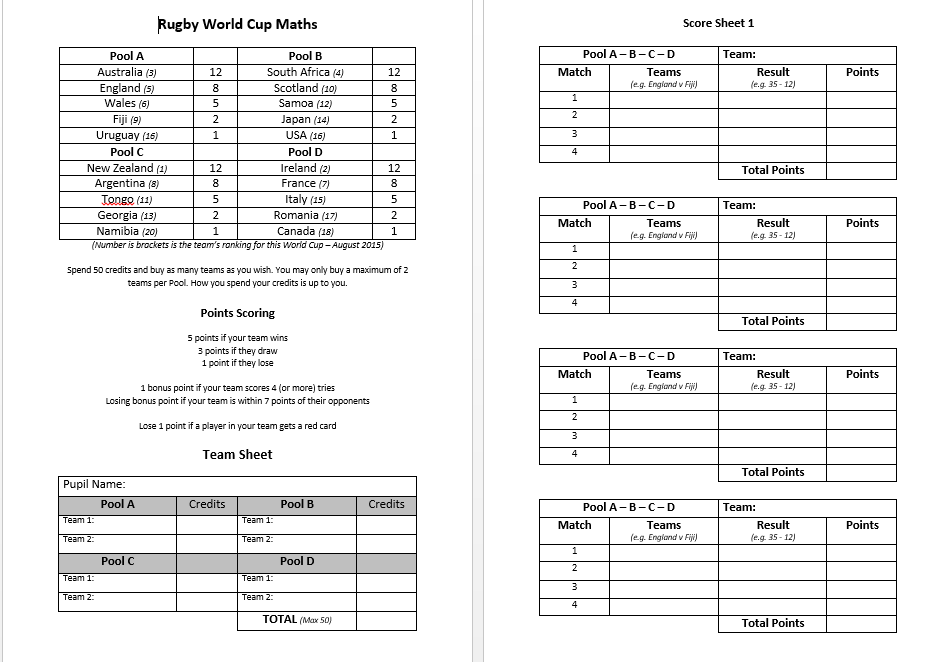
| rugby_world_cup_game_sheet.pdf |
Thanks to Mark Gilbranch @MGilbranch for creating this brilliant Rugby World Cup maths game, More detail can be found at his blog https://mrgteachblog.wordpress.com/ The image below would be good for students to use to analyse form from past world cups etc.
Rugby World Cup Team Guide.
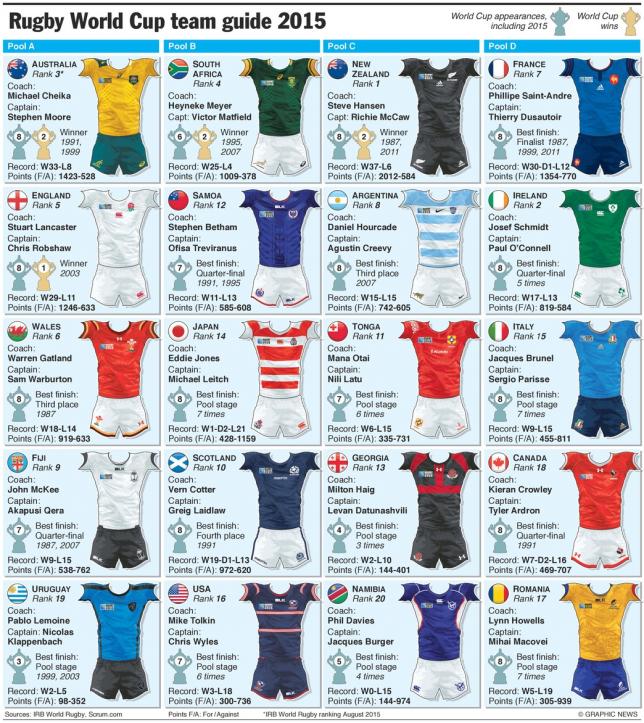
Lots of Data on this - could you:
Put the teams in rank order.
Which team has scored the most points, which team has conceded the most.
Looking at the stats, which team is most likely to win?
Which team has the best World Cup record?
Put the teams in rank order.
Which team has scored the most points, which team has conceded the most.
Looking at the stats, which team is most likely to win?
Which team has the best World Cup record?
Rugby World Cup 2015 Info.
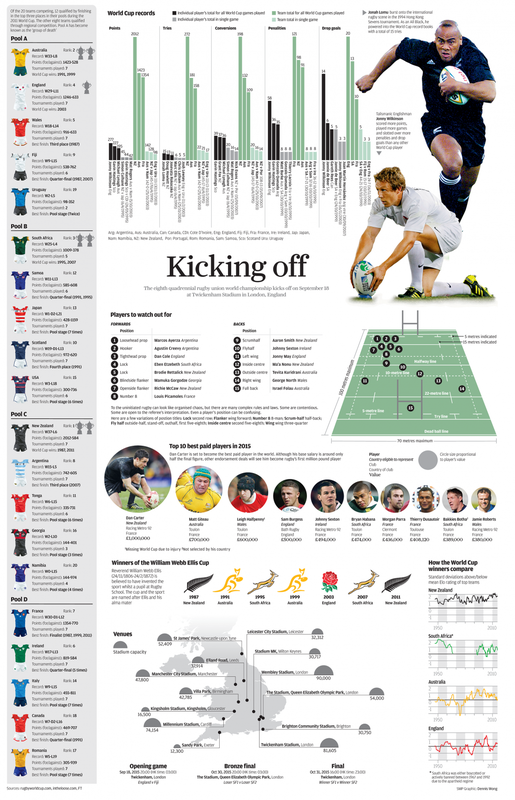
| rugbyinfoloads.pdf |
This infographic is awesome, please download to see the full detail and then get your students to pick apart the data.
Rugby World Cup Attendances.
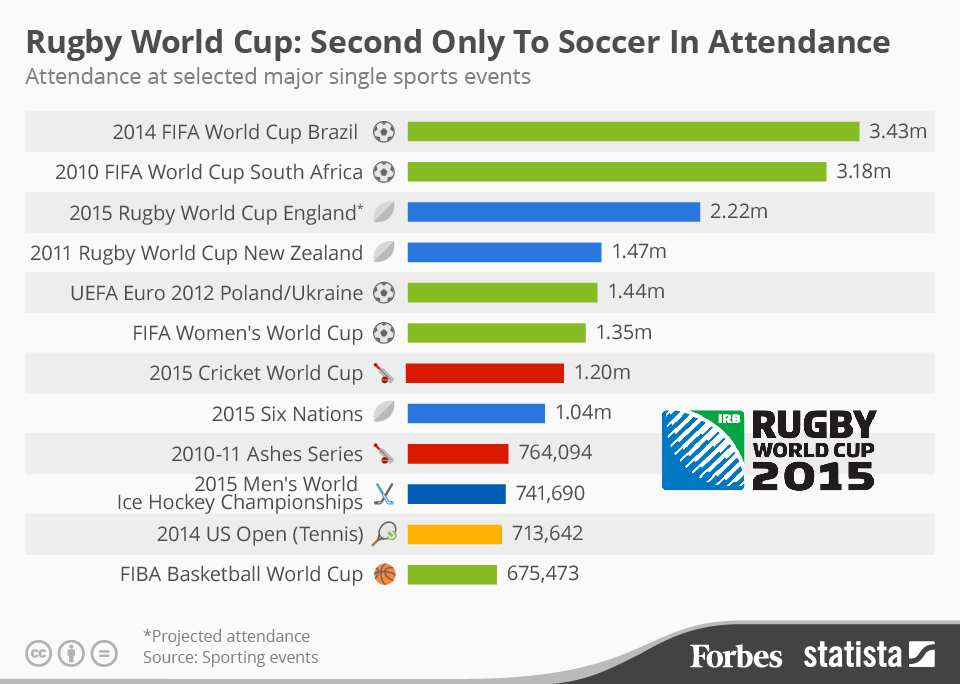
| rugbyworldcupattendance.pdf |
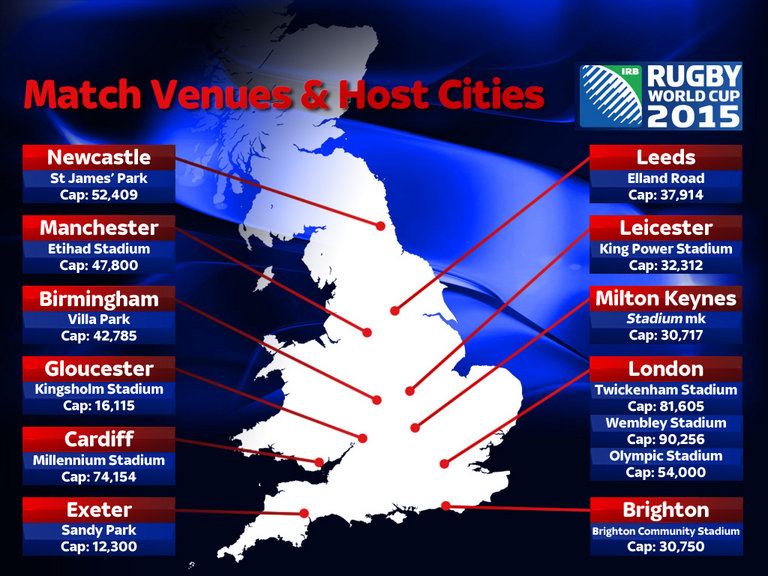
Rugby World Cup 2015 Match Venues and Cities.
| matchvenuesandhostcities.pdf |
Put stadiums in order of size.
Can you map the distance between each venue - what would be the shortest journey by road?
Can you map the distance between each venue - what would be the shortest journey by road?
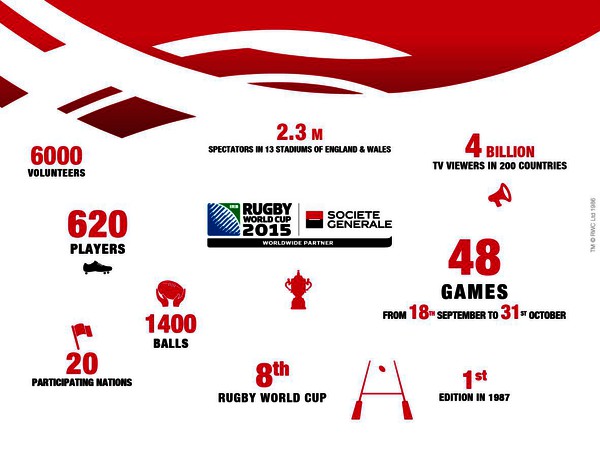
World Cup 2015 in Numbers.
| rugbyworldcupnumbers.pdf |
There is some interesting figures and stats on this poster but it isnt the most appealing, so maybe you could get students to redesig it to make it more interesting.
On average how many viewers per country?
how many spectators on average in each stadium? - Could you use the stadium stats to work out accurately how many in each stadium?
On average how many viewers per country?
how many spectators on average in each stadium? - Could you use the stadium stats to work out accurately how many in each stadium?
15 Rugby World Cup Facts.

| 15rugbyworldcupfacts.pdf |
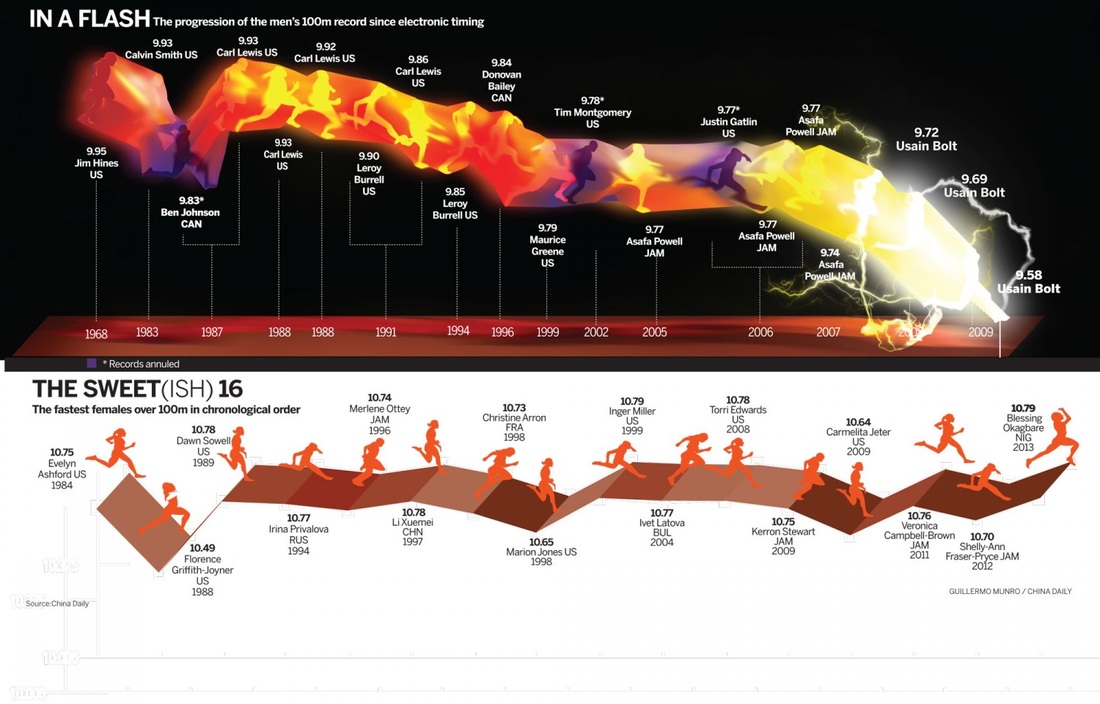
The Progress of 100m Times.
| inaflash100mprog.pdf |
Following Usain Bolts momentous win in Beijing, this would be good to analyse.
Compare times of the different sprinters
Why have times for men increased so much?
If Usain Bolt could continue at this pace over 400/800/1000metres or even a marathon, how long would it take him to complete?
Can you see a pattern in the mens and the womens times?
Compare times of the different sprinters
Why have times for men increased so much?
If Usain Bolt could continue at this pace over 400/800/1000metres or even a marathon, how long would it take him to complete?
Can you see a pattern in the mens and the womens times?
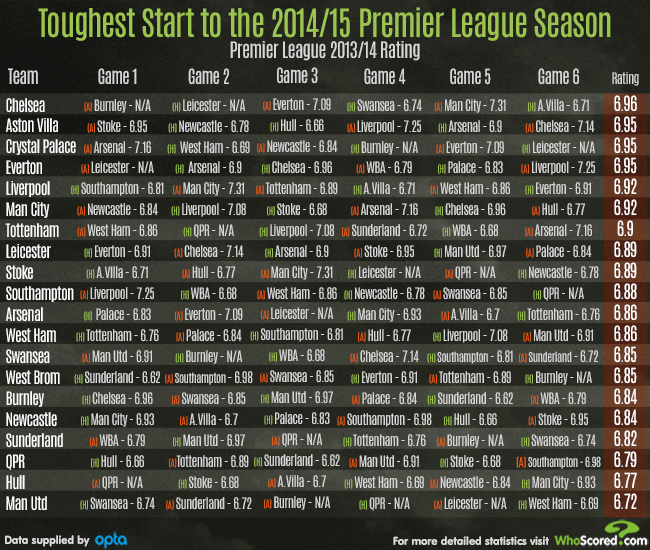
English Premier League 2015/16 - First 6 Fixtures.

The fellas at whoscored.com have taken the average rating of each team against their opposition, for the first 6 fixtures of the premier league. Find the average of each team and find out which team has the easiest start to the season and who has the hardest.
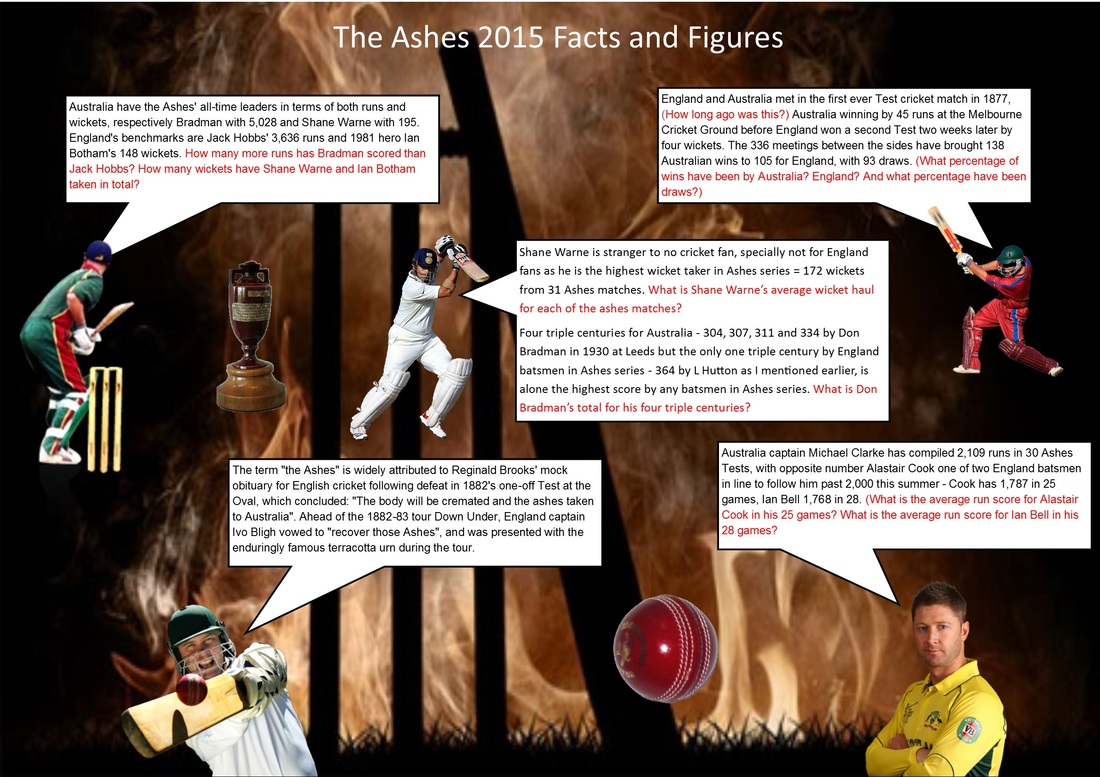
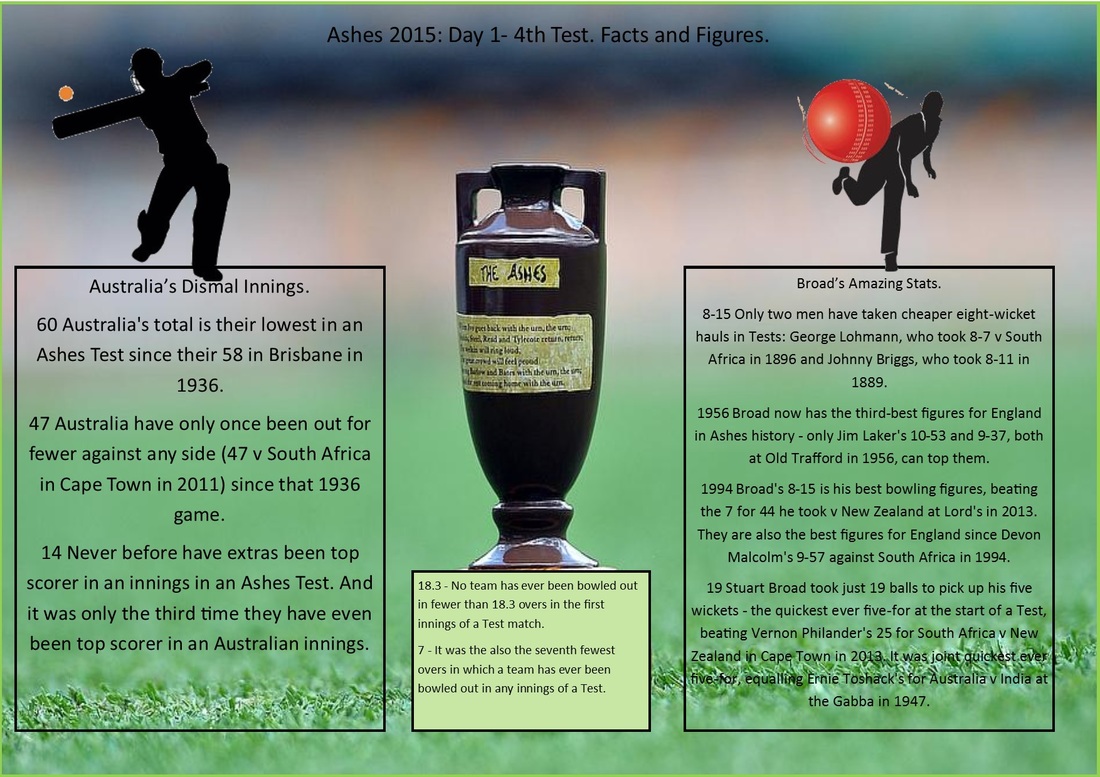
Ashes 2015 Facts and Figures.
|
| ||||
|
| ||||
Tour De France Facts and Figures.
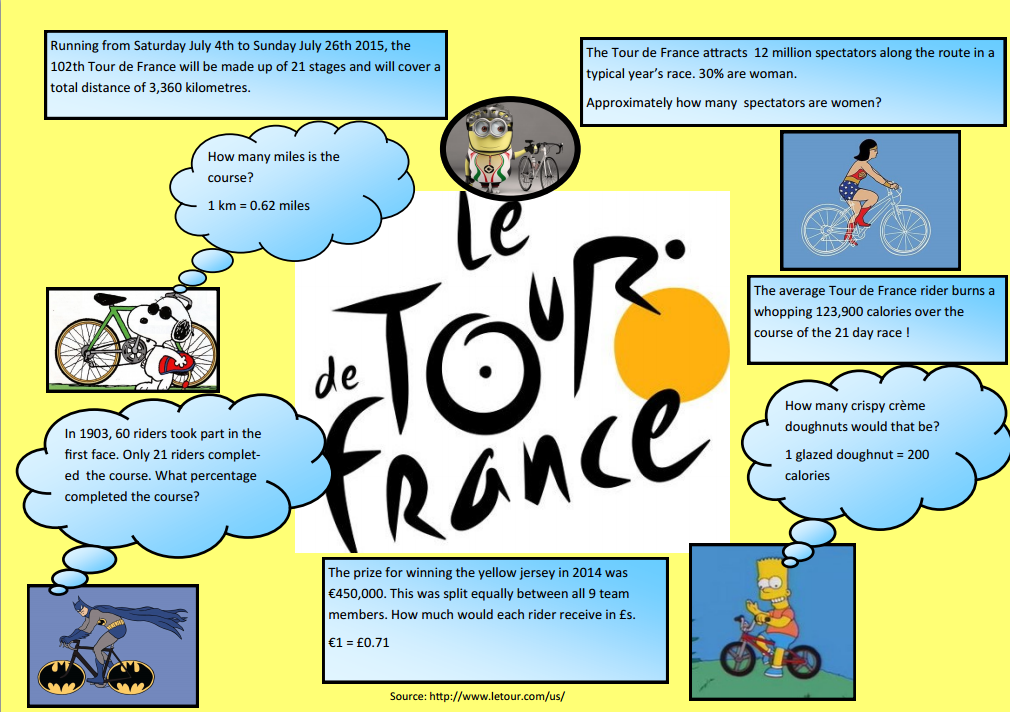
| tour-de-france.pdf |
Thanks to the amazing Theresa Young for this super 'Tour De France' facts and figures sheet.
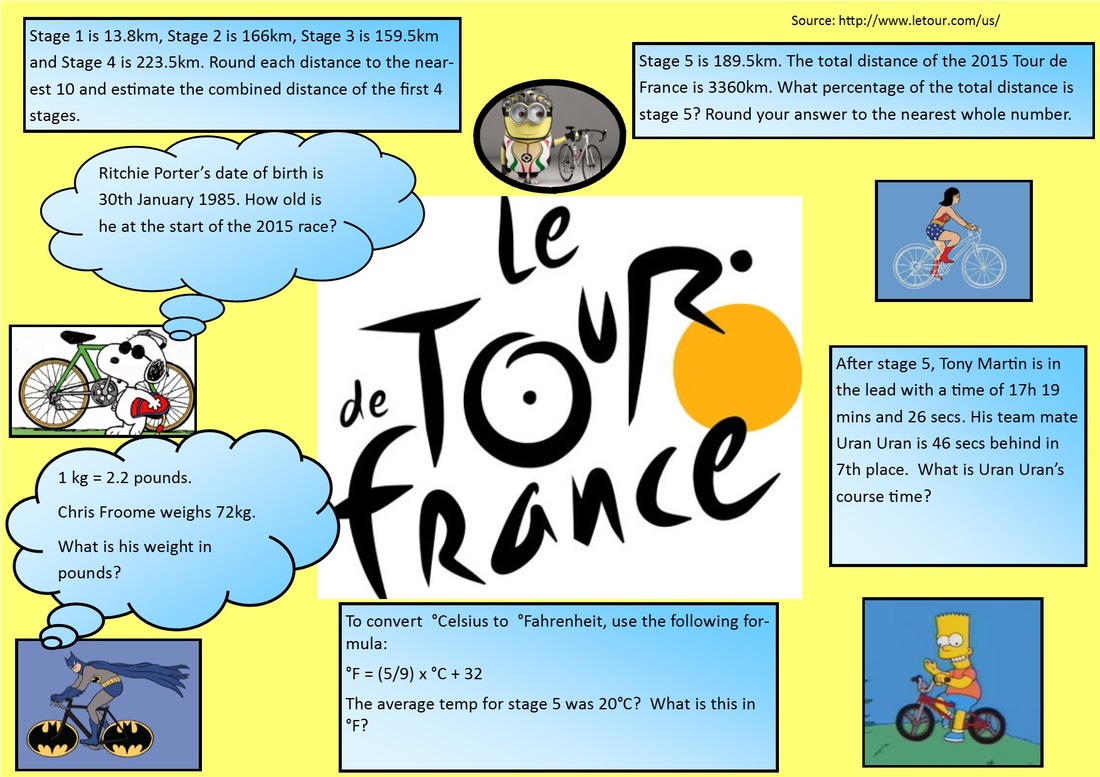
Tour De France in Numbers 2.
| |||
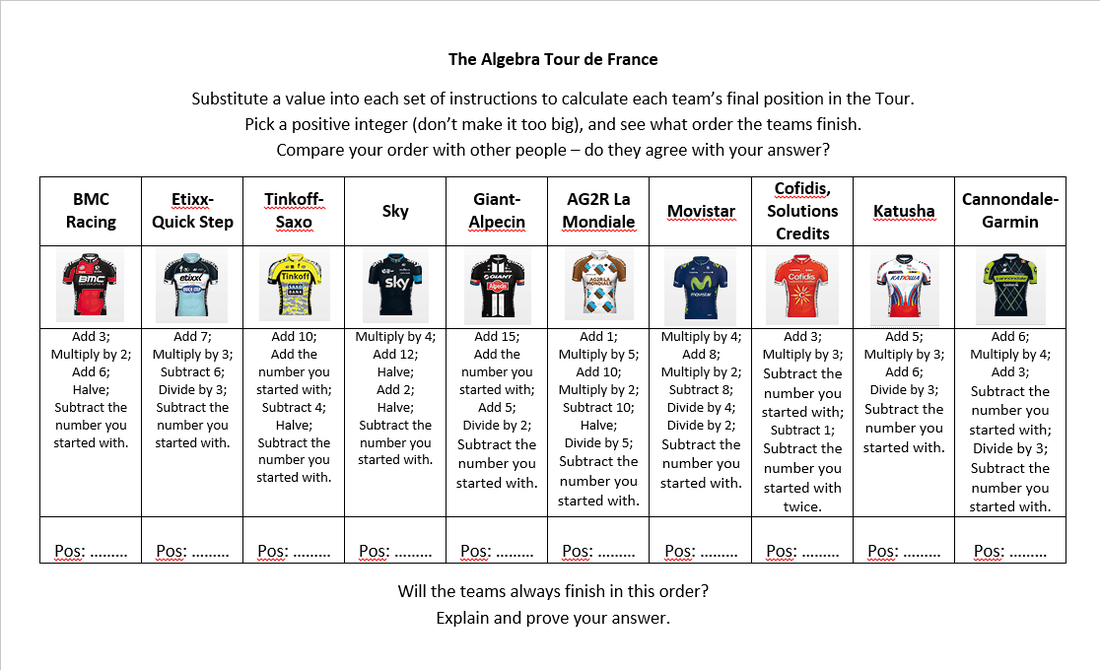
Tour De France Algebra.
|
| ||||
Thanks to Andy (Absolute 80s) Lutwyche for this excellent sheet.
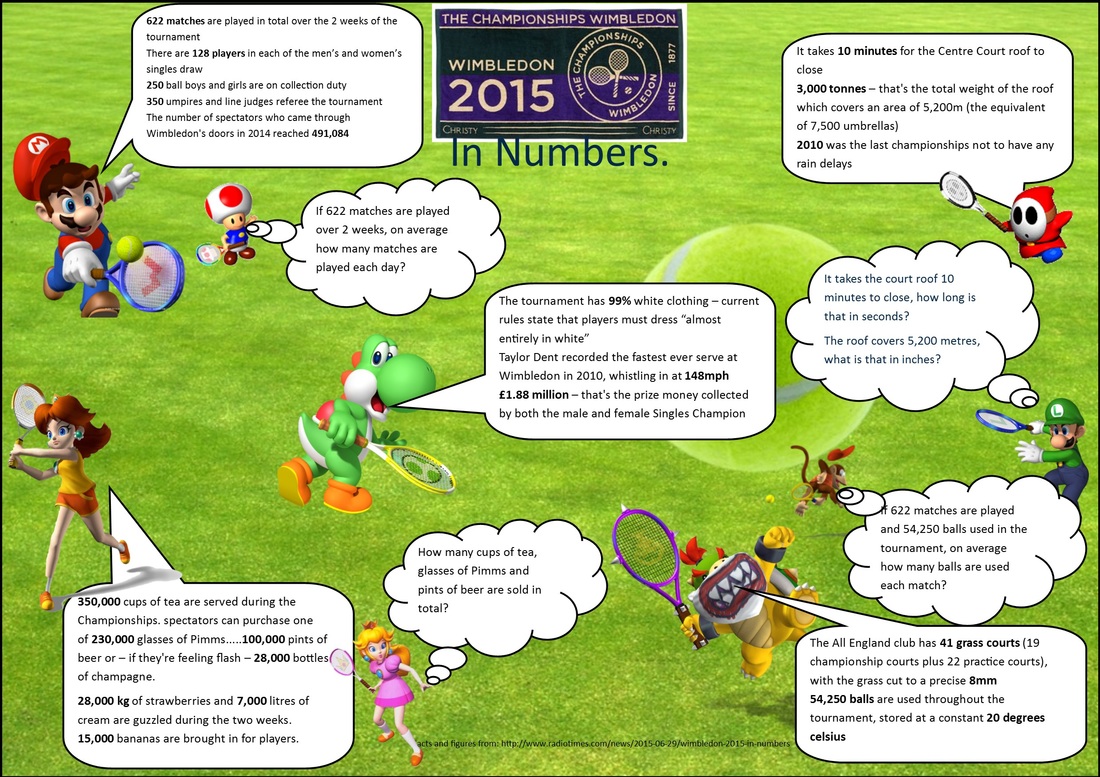
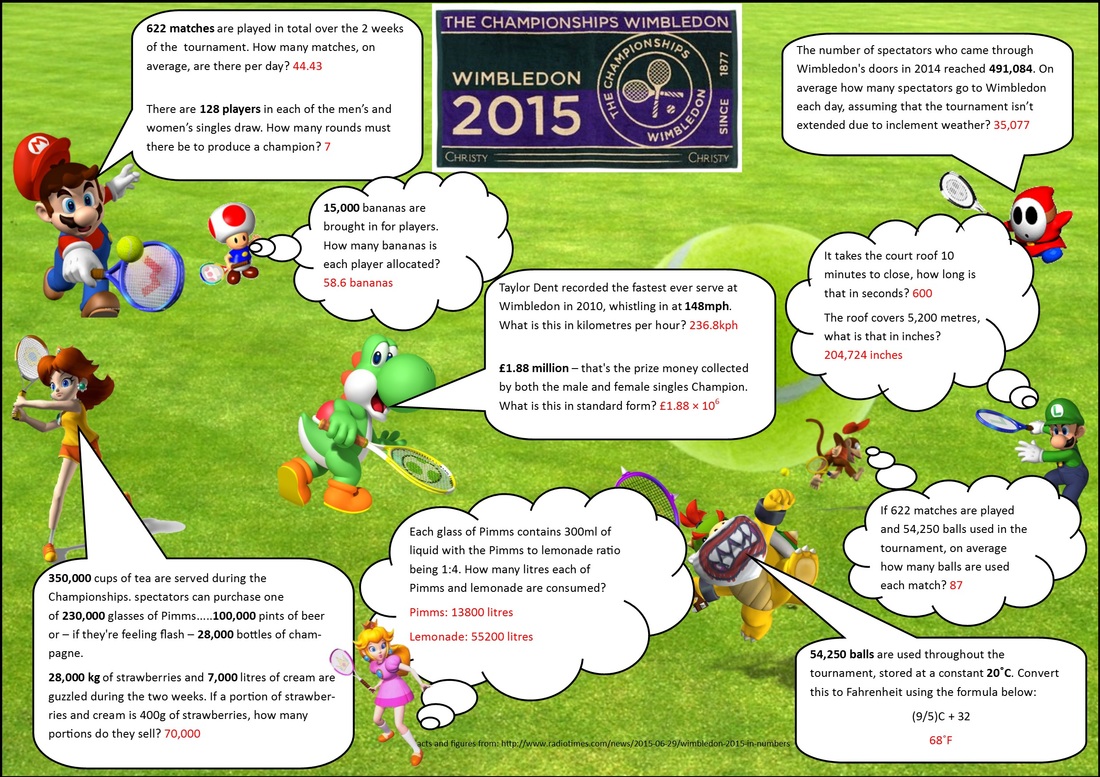
Wimbledon 2015.
Wimbledon 2015 in Numbers:

|
| ||||||||||||||||
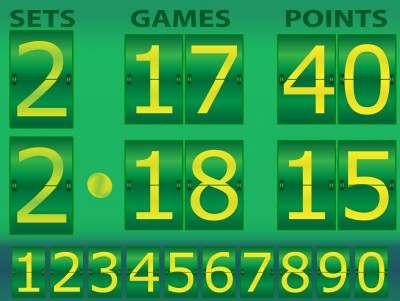
Starter: Tennis points.
Why during a game do the points go 15-30 then 40, why do the points not go to 45?
Could be a good starter for kids, ask them for their ideas and see what they come up with.
Could be a good starter for kids, ask them for their ideas and see what they come up with.
Wimbledon Maths Investigations.
N.B. the answers are on the first few pages of the pdf, the problems are below these.
| 10-brain-trained-numeracy.pdf |
| 09to11-courtintheact-numeracy.pdf |
| 61to66-tiebreakteasers-numeracy.pdf |
| 53to54-gamesetandmatch-literacyandnumeracy.pdf |
Which Gender Wins?

| rallyofthesexesgenderbattle.pdf |
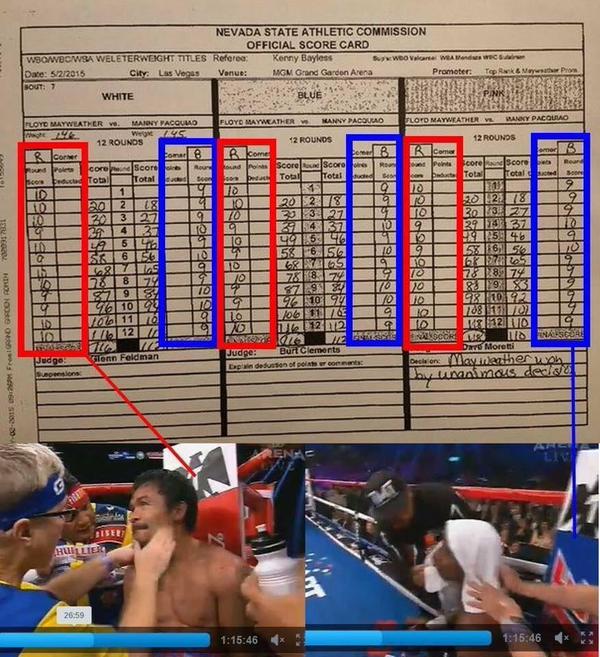
Mayweather V Pacquiao Fight Stats Maths.
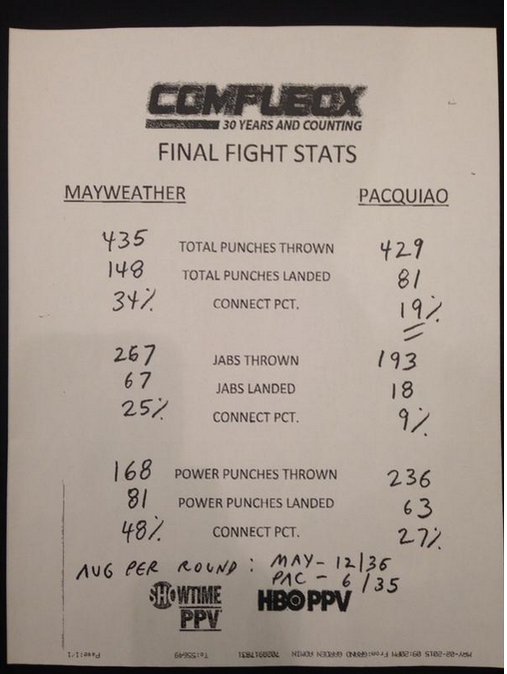
Here is the scorecard for the fight of the century, so much maths can be taken from this. Look at differences in punches thrown landed etc. jabs, percentages. How many more would Pacquiao have needed to land to win?
Mayweather V Pacquiao Resources.
|
| ||||
There was some controversy soon after the recent Mayweather V Pacquiao fight as the numbers didnt seem to add up - what do you think?
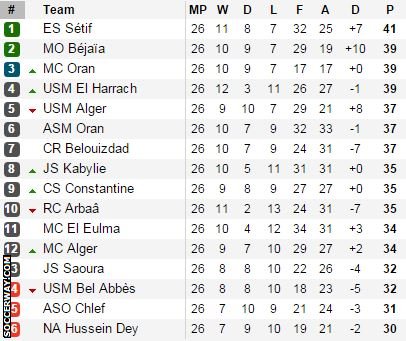
Algerian League Football.
|

|
Thanks to Mike Watson @WatsEd for finding this from the BBC website.
While the Premier League title race has fizzled out with"boring" Chelsea taking a 10-point lead, the same cannot be said for Algeria's top division.
Only 11 points separate leaders Es Setif and bottom club NA Hussein Dey in Ligue 1.
It seems the pressure is getting to the leaders as they have lost three of their past five games.
Second-placed MO Bejaia have lost four of their past five while MC Oran have scored the fewest goals but sit third.
Which team looks most likely to win the league? Look at the current form, if each team continued with the same pattern of form which team would be most likely to win the league? Which team would come bottom? How many points would each team gain. How many points has each team won in the last 5 matches?
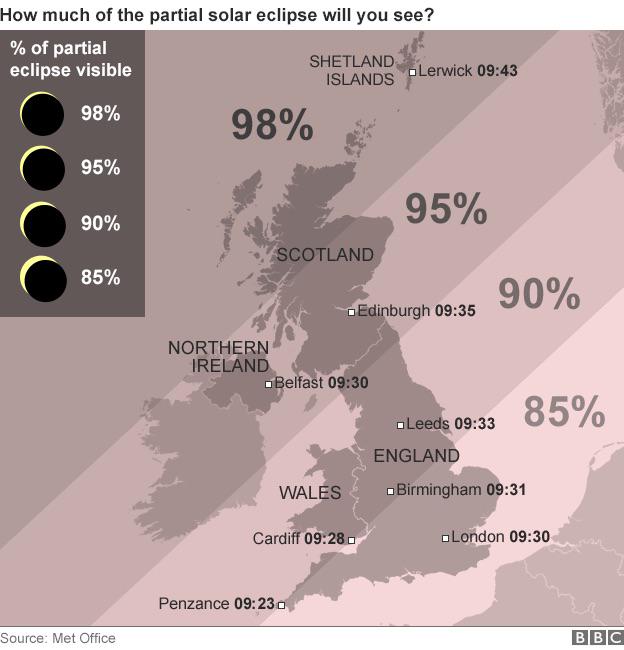
Solar Eclipse Maths.
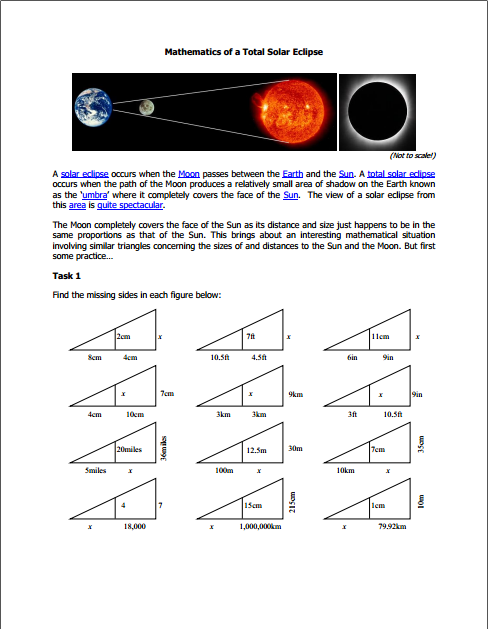
| mathematicsoftotalsolareclipse.pdf |
| solareclipses101.pdf |
| eclipses_of_sun.pdf |
Superbowl Maths.
| superbowl.pdf |
More Superbowl Maths.
| mathematics.pdf |
Prize Money in Sport: Men and Women
| disparityinmenandwomensprizemoney.pdf |
A really interesting graphic that looks at the difference between mens and womens prize money in major sports.
Apart from The English Premier League, which sport has the biggest difference in pay?
What is the difference in pay between every sport?
Can you put the sports in order of greatest difference in pay to the smallest?
Can you work out the percentage difference in pay for each sport?
How else could you show this data?
Lewis Hamilton: Title in Numbers
| lewishamiltoninnumbers.pdf |
Benali's Big Run - Maths
Southampton Football Club legend and ex. player Francis Benali, recently completed a 1000 mile run for charity. The run was an amazing feat, being accomplished in 21 days. Can you work out the answer to these questions based on Franny’s run.
| benalisbigrunchallenge.pdf |
Football Maths Resources
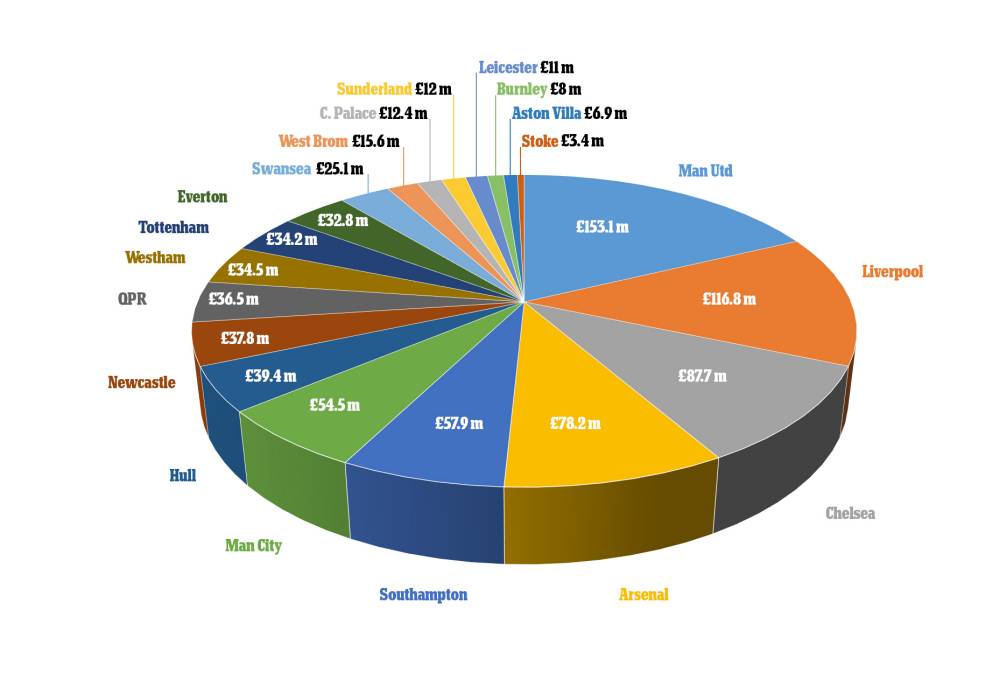
With a record breaking transfer window now closed, here is a breakdown of each team and their spending over the summer:
How much in total was spent by the clubs?
Can you divide the total spent equally between the 20 Premiership clubs - How much would they have spent each?
Angel Di Maria cost Man Utd 59.7 million how much did the rest of their summer signings cost?
Will the amount of money spent impact on a teams league position, keep track of the 4 top spending teams and see how they do over the season.
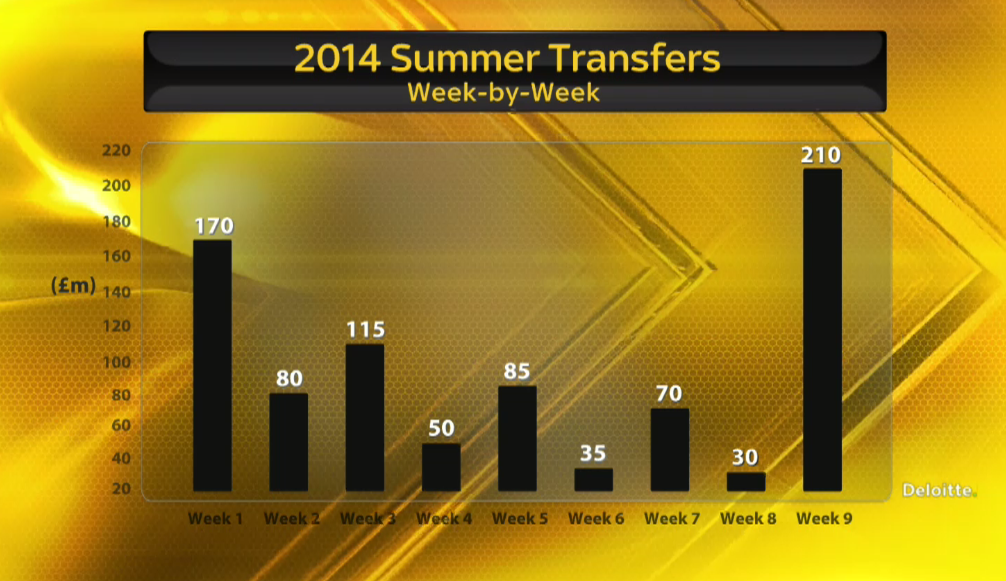
Look at the week-by-week spending below:
Why do you think that the biggest spending was in week 1 and week 9?
Why do you think it was so low in week 8?
Does the total spend below equal the same amount as the pie chart above?
How much in total was spent by the clubs?
Can you divide the total spent equally between the 20 Premiership clubs - How much would they have spent each?
Angel Di Maria cost Man Utd 59.7 million how much did the rest of their summer signings cost?
Will the amount of money spent impact on a teams league position, keep track of the 4 top spending teams and see how they do over the season.
Look at the week-by-week spending below:
Why do you think that the biggest spending was in week 1 and week 9?
Why do you think it was so low in week 8?
Does the total spend below equal the same amount as the pie chart above?
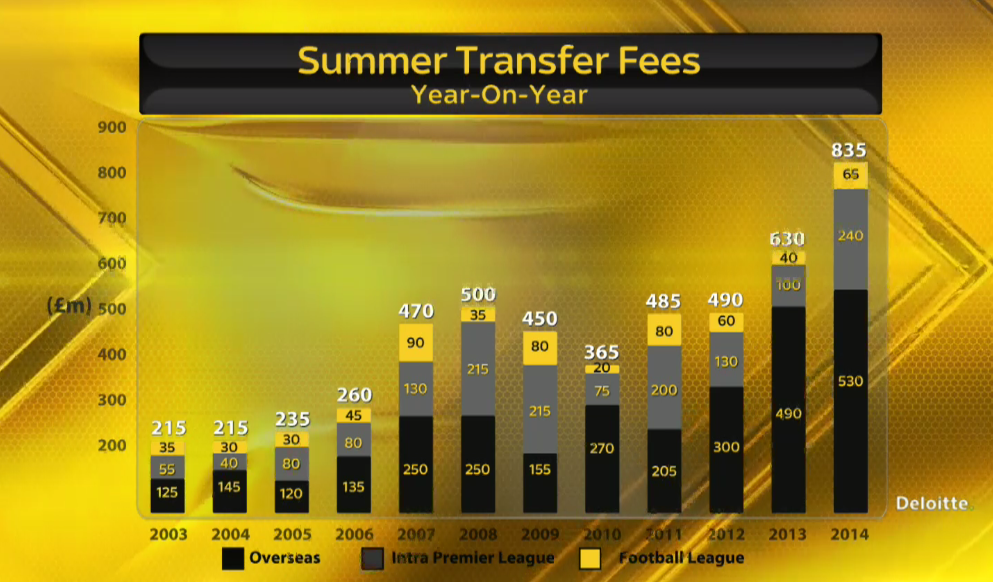
Take a look at the total summer spending from previous seasons, how much has the spending risen each year?
What area has shown the greatest spending?
What area has shown the smallest?
Can you predict how much will be spent next year?
Thanks to @gazneedle for finding these excellent graphics.
What area has shown the greatest spending?
What area has shown the smallest?
Can you predict how much will be spent next year?
Thanks to @gazneedle for finding these excellent graphics.
A tricky one to start with, this infographic from the brilliant whoscored.com website (they score players performance during a game) shows............
The challenge is to try and work out what it is showing us.
The challenge is to try and work out what it is showing us.
School Fantasy Football League.
I was going to write out this myself but Bryn Goodman (@bryngoodman), a Twitter friend has done a great job of it on his blog, so I am going to take his ideas from there. Please take a look at his blog as it is full of useful things.
http://bgoodman7.blogspot.co.uk/
Now that the World Cup has ended, there is the new football season nearly upon us. Every season, many of the daily newspapers organise a Fantasy Football competition. For the uninitiated, the idea is that you pick a team of 11 players who all have different valuations. You have a given budget to work with. Each player then earns points for your team for things they do in real-life matches such as score a goal, keep a clean sheet etc.
The data provided for the game provides lots of maths opportunities.
1. Addition and subtraction of numbers involving decimals.
2. Money problems - working within a given budget and working out change.
3. Data-handling. For example, pupils could generate questions for other pupils to answer about the players in the goalkeepers section. Drawing bar charts, Venn Diagrams, Carroll Diagrams of player information.
4. Investigating all possibilities through different formations of 11 eleven players e.g. 4-4-2, 4-3-3 etc. Could also work out all the different ways that a team could score a given number of points.
5. Percentages - if all player values were reduced by 10%, which players would you pick now?
6. Investigating truth of a given statement e.g. Liverpool has the highest total value of players.
7. Ordering decimals - For example, pick 8 players at random and order their values.
These are just a few ideas that I came up with quickly, I am sure there are many more. The good thing about the Daily Telegraph Fantasy Football is that you don't need to log in/register to pick a team or see the player information so the children can work on it using laptops/ipads.
Thanks Bryn
Maths and Football
This video looks at different ways that maths can be used in football.
The video starts by comparing the flight of the more traditional 32 panel football and the new 4 panel Brazuca. This could be a challenge for your children compare and contrast flight, speed, spin of various footballs.
At 5:20 they compare shot speed and technique of an amateur and pro footballer, the speed of shots is measured and time taken to reach the goal. You could compare the shots of premier league footballers, and technique of shooting.
The 5 fastest shots ever recorded are here http://hereisthecity.com/en-gb/2013/10/24/jm-the-5-fastest-shots-ever-recorded-in-football/
At 10:00 the video then goes on to look at running speed of players then finishes with a summary of how football clubs use the statistics to measure a players performance. See the Opta stats video below for more on this.
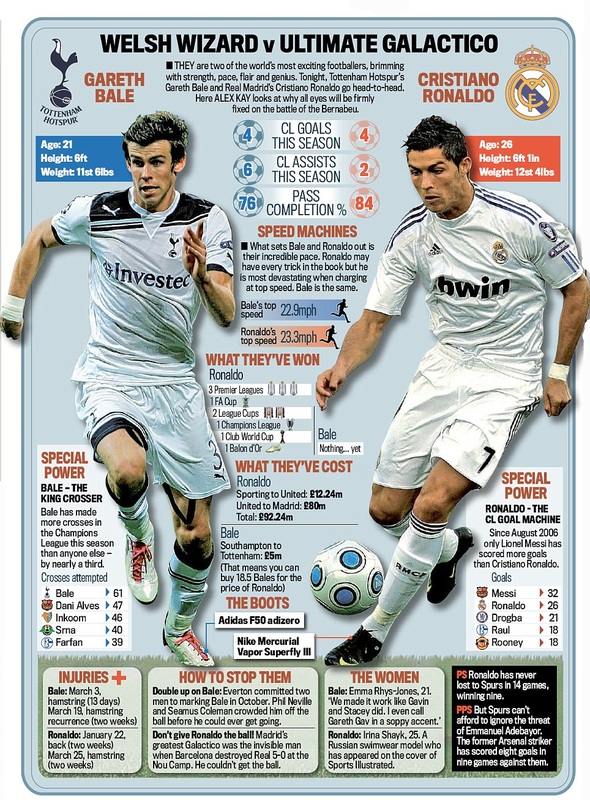
Ronaldo and Bale Footballs Most Expensive Players.
This short video show Ronaldo and Bale in action with various maths equations showing, calculating different areas of their game. You could ask your students how can maths be used to help these players? Why are these two the most expensive players? What makes them stand out from the others? Can you work out their running speed with and without the ball? Free kick speed? goals to games ratio. The image below may be helpful
Football Scatter Graph Investigation.
| scatter_graphs_premier_league.docx |
| scatter_graphs.docx |
I love these the top document has a brilliant investigation looking at wages and whether they correlate to a higher league position.
Numeracy and Literacy Football Resources.
| e3l2premierleaguefmathfenglish.pdf |
Despite having data from the 2010/11 season this is a very useful document with some great ideas.
Football Venn Diagrams
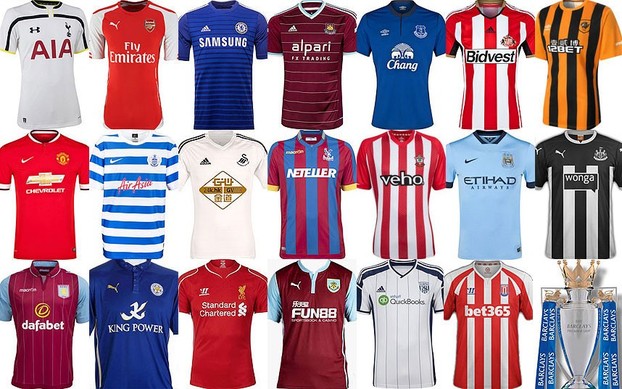
Thanks to Simon Blower @simonLMYL for sharing this idea with me on Twitter.
Using the shirts above you can look at all sorts of different sets.
Start with just two circles first and look at:
Winners - non-winners league, cup Champions League
Shirt colour
Shirt design
Shirt pattern
Teams that have/haven't England players
Then try with 3 circles and look for harder sets.
All resources needed can be downloaded below:
| venn1.gif |
| 3_circle_venn_2.gif |
Thanks to @ThisIsLiamM from twitter, who has made a pdf using the venn diagram resources, thanks Liam, great stuff.
23 and Football Birthdays
Looks at the number 23 and how important it is in football and with probability. What is the probability that two of the 23 people on the pitch shares a birthday. You may want to have a go at working out the probability that someone does share a birthday, get guesstimates, look at the opposite. work out how many different pairs of people you can make.
Look at the data for teams playing each other in the World Cup, do any of them share birthdays?
Look at the data for teams playing each other in the World Cup, do any of them share birthdays?
Anatomy of a Goal
The guys from Numberphile go to Opta to look at the anatomy of a goal and the maths it entails. The goal is Andre Iniestas' winner in the last World Cup.
Watch a game, or highlights of a game and map how it happens on the pitch co-ordinates provided. You may want to make a key for different events leading up to the goal. Map where different goal attempts happen. Do certain players only attempt / score a goal from certain areas of the pitch?
Watch a game, or highlights of a game and map how it happens on the pitch co-ordinates provided. You may want to make a key for different events leading up to the goal. Map where different goal attempts happen. Do certain players only attempt / score a goal from certain areas of the pitch?
| football_coordinates.docx |
Opta Stats Analysing the Game.
This video looks at the role that Opta takes in collecting data on a football match and how it used to inform media and football clubs. Have a look at some Opta player stats, can you see a pattern for players in a certain position?
http://www.optasports.com/
Watch a game and record how a player performs, start with one player, then try to record how a whole team are doing. Proforma below.
Each member of the class could focus on 1 player (work in pairs?) then collate the data afterwards? are there any patterns? Can you work out the percentage of passes completed, 50/50 duels won and tackles won?
Using the pitch worksheet above, track a players movement during a game, are there areas that he is weak in/avoids/is more dangerous in/ prefers?
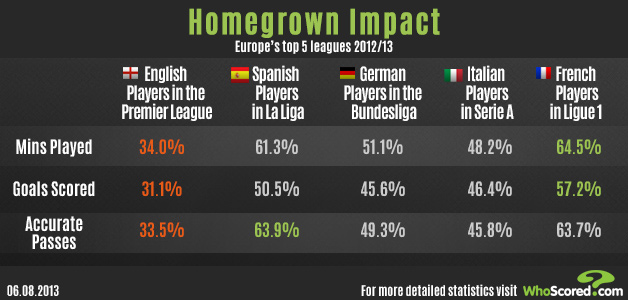
Leagues with the Most Foreign Players - Statistics
The Physics of Soccer.
How to Curve a Football.
The 'Physics of Soccer' and 'How to Curve a Football' are both linked and not strictly Maths but you could use maths to find some answers to questions:
What actually happens when you kick a football?
Who kicks harder-shorter or taller people?
How does a big follow through help your kick?
Answers to these questions can be found in the document below.
What actually happens when you kick a football?
Who kicks harder-shorter or taller people?
How does a big follow through help your kick?
Answers to these questions can be found in the document below.
| physicsofkickingsoccerball.pdf |
Statistics on Match Day
Top 5 Passing Teams in Europe.
Look at newspaper reports and stats after World Cup matches. Are there any patterns to successful team, do they have more possession? Win more tackles? Have a better passing rate or shots on target stat?
What are the key stats that make a successful / unsuccessful team?
What are the key stats that make a successful / unsuccessful team?
| 13-1099.pdf |
Maths in the Winter Olympics.
With the Winter Olympics just around the corner this video is perfect if you are thinking of doing any maths around the games. At only 5 minutes this covers an awful lot of ground, from number of players in a hockey game, to scores in skating, angles in curling, calculus in skating and analysing data and much more.
